
Here’s the thing about hockey…
As a Canadian in the Greater Toronto Area, I am scrambling for hope to cling on to as my beloved Toronto Maple Leafs are staring at a 1-3 series hole in their best-of-7 series against the Boston Bruins.
The Leafs drop game four at home while Boston is missing Patrice Bergeron, their prized two-way centre, to an upper-body injury. It’s ugly to lose with home-ice advantage AND the opposing team missing a key player. No less, the Leafs outperformed the Bruins.
Where can I find a means of consolation from the harsh reality of a 5-game exit for my Leafs?
- Maybe, accepting hockey is one of the luckiest sports and Las Vegas having the Leafs/Bruins series at marginal odds just means this sample is approaching a tragic outcome simply due to variance?
- Maybe, home advantage is important in the playoffs?
- Maybe, a goaltender just steals a game?
So begins my descent into sobering statistics to cope with my biased expectations the Leafs could defeat the Bruins.
What timeline are we in…
The Leafs are playing Boston because Boston lost their final game of the regular season to Florida, a streaking team who fell short of making the playoffs, leaving the Bruins 1-point short of passing Tampa Bay for #1 seed in the Atlantic division. This timeline would have given them a would-be first-round matchup against the wildcard: New Jersey Devils.
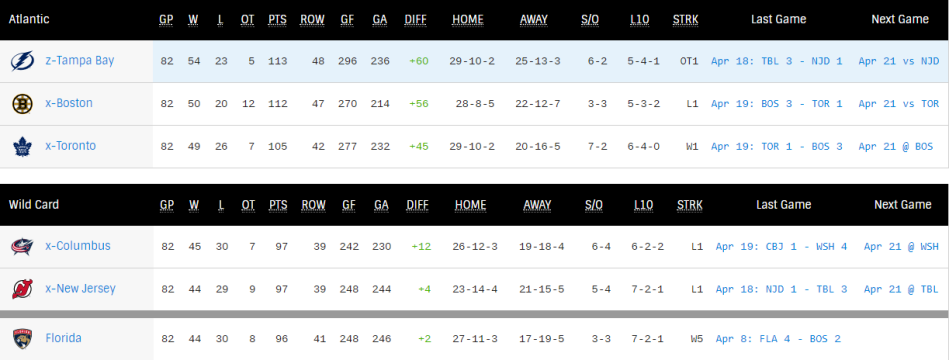
But, instead of a first-round bout with Tampa, the Leafs wind up with Boston.
Two questions here:
- A finish that close in the Atlantic implies both Boston and Tampa are evenly matched against the Leafs so who cares who the Leafs played, right?
- The difference between Tampa Bay and Boston playing the Leafs in a best-of-7 series would be insurmountable in 10,000 simulations, right?
Maybe I can find a scapegoat to make this hurt less. As I look at the comeback Toronto needs to muster up to advance for round two, I comfort myself with a mantra:
“the Leafs would have matched up better versus Tampa.”
And it helps me displace the disappointment.
A State Space Model
I embark down a Bayesian road using packages I know not. The breadth of this is covered by the following article that I must give immense credit to.
A state-space model to evaluate sports teams by @StatsByLopez
It includes a 17-18 NHL Regular Season database and the code in R I used to produce the following models and outputs:
Let’s fit a model that can measure team-strength (theta) and home-ice advantage (alpha) across the league to simulate a 7-game series between the teams. This is a simple way to simulate the Vegas odds on a series.
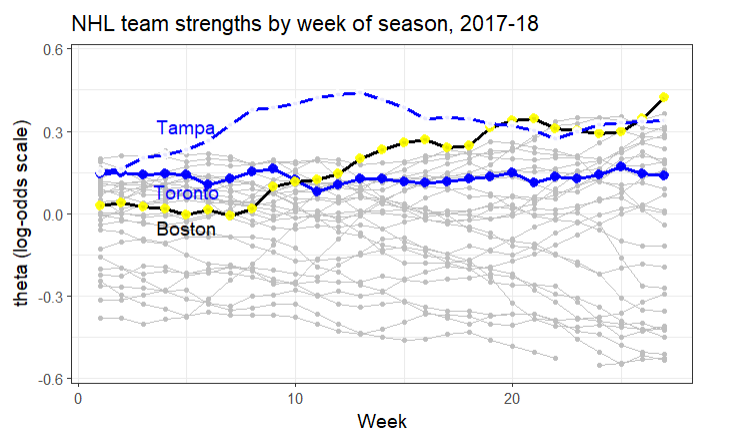
First, lets look at team strength throughout the year. It certainly looks as if both teams are superior to Toronto heading into the playoffs.
Boston is playing the best hockey they have all season, while Tampa is retreating back to their norm. Toronto is consistent, at the very least.
Here’s a look at the same chart but distributed on the x axis and focusing on the last six weeks leading to the playoffs:
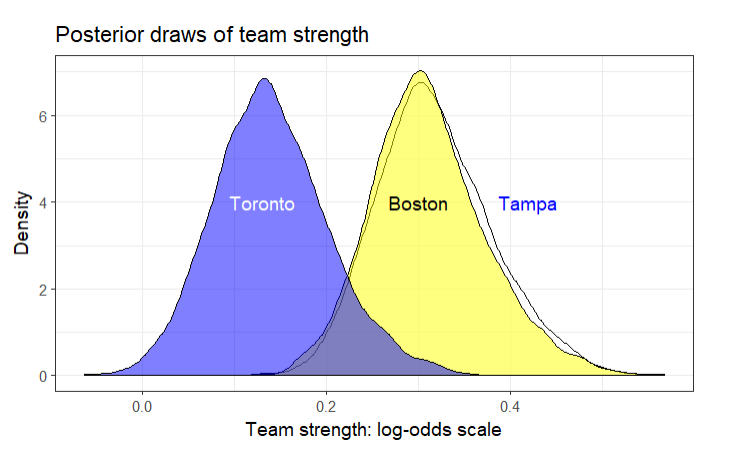
We are confident the Leafs are statistically worse than both Tampa Bay and Boston in the final six weeks of the regular season – notice the lack of overlap in the graph above – but that’s just one part of the puzzle here.
Here’s a draw (sample) from the regular season’s Las Vegas betting odds for the home advantage across the league.
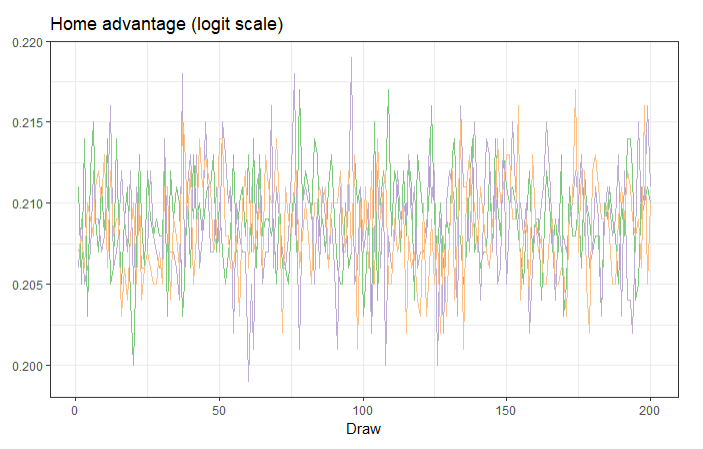
Remember this is an average that is approximately 5% in favour of the home team on the condition of a similarly talented opponent.
These are the tools we’ll use to simulate our playoff series using logit, similar to how Las Vegas betting odds are calculated.
Running the Simulations…
We have all the team’s strengths and home advantage records throughout the season to simulate a best-of-7 series.
We set up a for-loop that takes seven samples from each team and adds the home advantage to each game — 10,000 times for good measure.
Boston (home) vs Toronto
boston.sim.wins <- 0
for (i in 1:10000){
 toronto.strength <- sample(team.1$beta, 7)
 boston.strength <- sample(team.2$beta, 7)
 home.advantage <- sample(z$alpha, 7)
 logit.games <- boston.strength - toronto.strength + home.advantage*c(1, 1, -1, -1, 1, -1, 1)
 prob.games <- exp(logit.games)/(1 + exp(logit.games))
 boston.wins <- rbinom(7, 1, prob = prob.games)
 do.boston.win <- sum(boston.wins) >= 4
 boston.sim.wins <- boston.sim.wins + do.boston.win
}
sum(boston.sim.wins)/10000


[1] 0.521
Boston wins ~52.1% of the time with home advantage in our 10,000 runs.
When flipping the home advantage to Toronto, they gain ~4.58% advantage, making them the favourite in the series. This couldn’t get any closer.
Tampa (home) vs Toronto
tampa.sim.wins <- 0
for (i in 1:10000){
 toronto.strength <- sample(team.1$beta, 7)
 tampa.strength <- sample(team.3$beta, 7)
 home.advantage <- sample(z$alpha, 7)
 logit.games <- tampa.strength - toronto.strength + home.advantage*c(1, 1, -1, -1, 1, -1, 1)
 prob.games <- exp(logit.games)/(1 + exp(logit.games))
 tampa.wins <- rbinom(7, 1, prob = prob.games)
 do.tampa.win <- sum(tampa.wins) >= 4
 tampa.sim.wins <- tampa.sim.wins + do.tampa.win
}
sum(tampa.sim.wins)/10000

[1] 0.4256
Tampa wins ~42.56% of the time. Significantly lower…
If Toronto has home advantage, they gain ~2.54% advantage, showing a more imbalanced series.
The Mantra was True…
Oh boy, I was right to think the Leafs were better to play Tampa, but why is that?
Looking into the prob.games part of the simulation, Boston and Toronto are strongly favoured to win at home and whomever has home advantage are the team likely to win the series. There isn’t much room for an upset. This is consistent with our findings when switching the home advantage to Toronto.
When I peek into Tampa’s performance, the probability they win in Toronto is by margins – resulting in them often dropping a game on the road – giving Toronto the 7-game series advantage. To highlight, Toronto and Tampa’s regular season records at home are the same 29-10-2 record, but the probability Toronto accumulated at home throughout the season make them the more confident pick in terms of consistency.
So there is an approximately 10% difference in the favour of the Leafs to win a 7-game series vs Tampa compared to Boston. But what does 10% really mean in probability. The Leafs will only get an extra series win 1-in-every-10 series simulated. That doesn’t even sound like much? And it isn’t.
The Leafs matching up to Tampa compared to Boston is far more favourable in 10,000 simulations, but a series occurs only once in real life.
Numbers are just numbers, and at the time of print the Leafs are now heading into Game 7 vs. Boston. The variance has evened out and the likeliest series to go to 7-games is doing so.
Grasping at little advantages won’t matter in the long run. I need to hope the variance evens out and the Leafs can turn this series around.
Also worth noting, Lopez makes a twitter poll to investigate the public’s perception of home advantage and reveals the lack of impact it makes on a series — about a 4% swing or 1 in every 25 series:
The specific codes I used for my visuals can be found on my GitHub, but the majority of the code can be found in Lopez’s article – try it yourself if you feel confident enough. Here’s a challenge: try to run the simulations for Round 2 matchups!

0 comments on “Was Tampa Bay the Easier Round 1 Match-up for the Leafs?”