
Oftentimes, the challenge in data science isn’t the science but obtaining data to conduct the study on—reliable, quality data that’s relevant to the questions being asked. Although much of the open-source data I’ve browsed these past months seems reliable, I had difficulty finding data pertaining to some niche business/football questions I’m most interested in (or at least data synthesized to answer football questions a different way from the norm).
This is where my inspiration comes for “webscraping”; simply put, having the computer navigate to a web page, find information, and capture it. I’ve come to understand that Python is traditionally a more all around application developing tool, and R is more for statistical tests and complex mathematical computations. Although both can do both as packages are contributed over the years, I’d like to collect the data with Python and analyze it in R.
I found myself looking for a book on Python to self-study, specifically on how to use it for webscraping. I landed on Automate The Boring Stuff, and sure enough, there was a chapter on webscraping. As much as I wanted to skip half the book and just start webscraping, I knew from experience that with computer science and coding, surprises will come up. So I decided to start from the ground up, learning and working with data types, structures, common functions and handling errors in Python. I found most of the book to be relatively painless and practical. The examples and exercises are well thought out and make for easy learning.
This article will go through two examples of webscraping with Python. The first one, collecting Canadian Underwriter “insPRESS” article headlines, dates and authors, is fairly straightforward. It served as a great exercise to get my feet wet. The second example is what I’m really trying to achieve: collecting box score team stats from every regular season NFL game in 2017. Now this one, I had to put on my thinking cap to get the data into a specific structure. Diving right in…
Finding the Desired Web Page Elements
In a nutshell, the two-step webscraping process I learned is: download a web page using a Python module called requests, then extract specific parts of the web page using the BeautifulSoup module.
So on the first example. Let’s orient ourselves around the Canadian Underwriter insPRESS articles listing:

The Canadian Underwriter website lists their “insPRESS” articles, about a dozen per page. Each page has a consistent link/URL format:
http://www.canadianunderwriter.ca/inspress/page/7/
Each listed article is displayed in a box, containing sections for the headline and subheadline. While we’re here, we also need to determine how these components of the web page are coded under the hood. I happen to be using the Google Chrome web browser. There, we right-click the section we’re interested in and select “Inspect.” Other browsers should have an equivalent functionality.


Make note of where our information is located. The headline and subheadline are embedded within the <h4 class=”headline media-heading“> tag and the <small class=”meta“> tag respectively, and hierarchically under the <div class=”media-body“> tag.
Now we have enough information to formulate a Python script that captures this basic article information. Our first step of the two-step process is to download the web page using requests. We do this with the following code:

At this point, the webpage variable holds the full textual (code) script that builds what the user sees on their internet browser. More specifically, the .get function prompts an initialization of a Response object when url is requested from the client/computer. Then the .text function of that Response object captures the textual representation of the web page/Response.
The second step is to extract parts of this web page with the BeautifulSoup module.

First we import the module and initialize the BeautifulSoup object (call it pageSoup). It will be initialized based on webpage from previous step. Then we use the functionality of the BeautifulSoup module/object and extract the first headline and subheadline that show up on the page with .select.
Remember when we were orienting ourselves around page seven of the insPRESS article listing web page, we made the observation that the headline is embedded within the <h4 class=”headline media-heading“> tag under the <div class=”media-body“> tag. Preceding the class name with a “.” (and replacing spaces with them too) captures the element with that class name. The way we have two class names passed there means we want the second element that’s hierarchically below the first element. (Note: If we only want the second element that’s directly under the first, we use ‘.className1 < .className2’. (For more selection criteria, see appendix at end of this blog.)
Furthermore, remember when we were orienting ourselves around page seven of the insPRESS article listing web page, there were about twelve articles listed on that page. The .select function here actually generates a list of twelve tag elements, each accounting for an article shown on the page. To retrieve the text from the first one, we add “[0].getText().” The second and third articles would be [1] and [2], so on and so forth. The code below shows the raw text that’s retrieved and saved into our firstHL and firstSHL variables.

Well, that concludes webscraping with Python using BeautifulSoup… but wait! What about the other eleven articles on that page? What about all the other pages with dozens of articles? What are those “\n”s and why are there so many spaces? How do I pick out just the date and who the article was by? How will we build a consumable data set to analyze?!!
Cleaning the Data
Well, these are all the unknowns I knew would somehow sneak up if I were to skip straight to the webscraping section of the book. Thankfully, I took extra time to read about and practice control statements, working with lists vs tuples, string manipulation and regular expressions, and reading and writing files, all in Python. The following is high-level pseudocode for how I completed this task end-to-end. My solution (CAUW_PRSS_Scrape function) takes in the number of pages desired to collect insPRESS headlines and subheadlines from, and outputs a .csv file containing the headline, date and the author of each article.

The complete code is published on GitHub. Below is the actual result after calling the CAUW_PRSS_Scrape function.
(Edit: Read my follow up article here, where I analyze this article headline data.)

Moving on to the second example: collecting box score team stats from every regular season NFL game in 2017. Again, lets get ourselves familiar with the website we’d like to scrape.

Just as we did on Canadian Underwriter, we make some necessary observations about the web page we’d like to scrape data from:
- Each match has the same URL, ending with the date of their match and two teams’ abbreviations.
- The box of information under TEAM STATS is accounted for under the <table class=”team-stats“> tag.
- Stat lines within this box are accounted for under the <tr class=”stat-category“> and <tr class=”sub-category“> tags.
Now on to our second step. The first two lines below download the complete textual script of the web page. The subsequent two lines take that downloaded gamePage, initialize a BeautifulSoup object pageSoup and extract the team stat lines/rows.

The statRows variable now represents the list of <tr class=” “> elements within the <table class= “team-stats“> on our web page. We find the number of elements on this list using the len() function: 36. I then loop the .getText() method to view the contents of the 1st, 2nd, 3rd,…, 36th element on this List.

I view 18 at a time due to screen-capture limitations on my computer.

We have the bare essentials locked down for now. However, again, just like we had from Canadian Underwriter, there’s still lots to do outside of the webscraping itself:
- How will we automate visiting the web pages for all 2017 regular season NFL games?
- Are we building a list of tuples again? How do we want our .csv file to look in the finished product?
- How will we deal with those “\n” new line characters this time? What’s happening with the “Red Zone Eff.” and “Goal to Go Eff.” stat lines?
Automating Web Page Links
Here is an NFL schedule grid I’ve always used for my analysis tool. I simply copied and pasted it into Excel. Let’s take it a step further here and save the grid in .csv format, import it to R and create a dataframe in R.

Remember, the distinct list of URLs we’re trying to build include the date of the match and the teams involved, in the format YYYYMMDD_ROADTM@HOMETM. I created a single list of matches from the grid by creating 17 copies of the 32 teams down the left-hand side—simulating the 17-week regular season—and appended all week two opponents below the week ones, week threes below week twos, week fours below week threes, and so on and so forth. At the end, I have 17×32 pairs of teams.

I conduct the above operation with a looped rbind(). Each iteration, I increment the week column by one and target one column over to append down.
Afterwards, I have a week column, a team on the left, and a team on the right. There’s still duplication and unnecessary information to be tidied up. That is, ATL|@CHI and CHI|ATL are both listed, and BYE weeks are also listed, which is unnecessary. Therefore I remove any record where the right hand side does not contain an “@” symbol.
Now, the dates. I know the majority of the games are played on Sundays, and the season-opening Sunday was on 2017-09-10. So I created another data frame, week 1-17 down the left column, and increment the right column by 7 days, starting at 2017-09-10. I merged the two data frames I have on week, and get a dataframe with Week, Date, Road Team and Home Team columns. Lastly, some games are played on Thursdays and Mondays, so I manually had to create a list of such games and merge those in with my main schedule data frame.
The complete R script is available on GitHub. The following dataframe is exported to a .csv file from R, and imported to Python to build URLs for each game’s web page.

Data Structure
At the end of the day, I need a structured dataset where the stat categories are field names across the top, and each team’s weekly performance metric is listed below. Scraped off the web page are side-by-side observations per game, not per team (records represent a game, rather than a team’s performance in one game). Also, we need to do something about those “\n”s, and how “Red Zone Efficiency” and “Goal to Go Efficiency” are actually two-observation side-by-side comparisons (fraction and percentage, observed and compared).

My solution had two steps: first, create a set of as-is scraped data; second, use that scraped data and create another set in a more consumable format. Both datasets in Python will be a List of Lists—each game’s 36 paired stat categories will be captured into a List, then all these Lists will make up one big List representing all games in the season. The finished dataset will be the same, except the 36 stats Lists will be by team, and all teams’ metrics for all weeks will be gathered together in one big List. Below is a simple demonstration of how I’m going to generate these lists.

At line 1, I initiate an empty List. Lines 2 and 5 are where I append elements (which happen to be Lists containing just “1” and “4,” respectively) to the outer List. To append elements to the inner lists, I specify which inner list I want to add to using [ ], and append the subsequent elements to the inner lists on lines 3, 4, 6 and 7.
Below is where I implement this logic. The outer loop initiates the inner Lists, synonymous to lines 2 and 5 above (games, down). The inner loop adds the contents to the inner list (and stat categories, across).

The csv.writer() method is from the csv module (needs importing), and it writes the contents of our List of Lists to a .csv file as per below. This is only for illustrative and error tracing purposes.

Now, to convert the above list of game stats to a list of teams’ game stats, I essentially use the .splitlines() function to separate the multi-line data. For example, it splits “1st Downs\n18\n20″ to a List [“1st Downs”, “18”, “20”]. I loop through each game twice, taking the second line (i.e., second element of the .splitlines() List) for the road team’s observation, and then again taking the third line for the home team’s (with the exception of “Red Zone Eff.” and “Goal to Go Eff.,” where I take the fifth line for home team). Complete code found on GitHub.
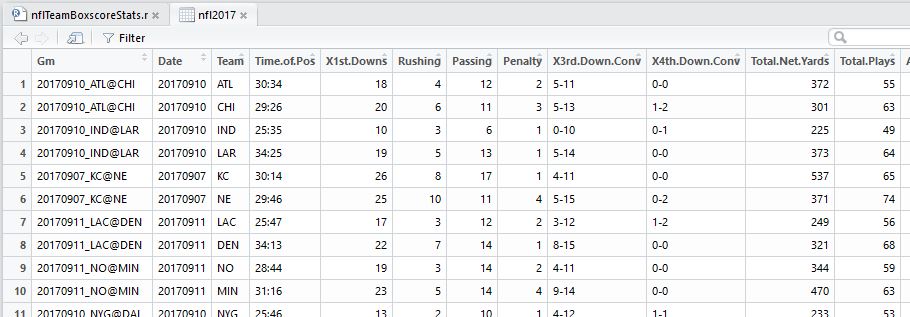
The above screenshot is from RStudio, so I’ve ensured that the output from my Python webscraping is consumed properly in R (via .csv export/import).
Now We Have Our Data!
In conclusion, I was ecstatic to take these projects on. There’s potential in doing text mining on the insurance article headlines—that’d be a fascinating avenue to explore. Mining for undervalued teams and players in NFL Fantasy Football through analytics has been something I’ve always done by copying and pasting stats into Excel. The time spent in learning Python and webscraping certainly enables me to scale out that operation I masquerade by night. Next up on that front is to implement my current analysis framework on this scraped data in R. Stoked! Check my GitHub repositories for updates if you share my interest in these subjects.
Appendix: BeautifulSoup select() criteria, credit to Automate the Boring Stuff with Python: Practical Programming for Total Beginners, by Al Sweigart.


Pingback: Text Mining and Sentiment Analysis with Canadian Underwriter Magazine Headlines – datacritics
hi
just in case, do you know the OUTWIT software; I am using it frequently to capture data from the web
LikeLike
Pingback: Using Data Science to Help Win Fantasy Football Games – datacritics